Ian Landsman
May 9, 2017 / Inside HelpSpot / 399 Words
One advantage of using a help desk like HelpSpot is that you have access to an extremely rich data set that can be leveraged to monitor your support team’s health and inform decisions. Sometimes a custom report is just what is needed to answer an important question. This article will walk through how to connect HelpSpot with Microsoft Power BI Desktop in order to build dashboards and reports.
The first step to connecting to Power BI Desktop is to decide what API method you will use. For some queries, the private.request.search method will work quite well. For other uses, you may want to use the private.filter.get call to return the results of a filter you have already built. This method has the advantage of being able to easily build advanced filter logic and control your returned fields all in the HelpSpot user interface. It’s a good idea to test your API calls in the browser and check the results that you are getting back. For more information on API call formats, visit our API documentation.
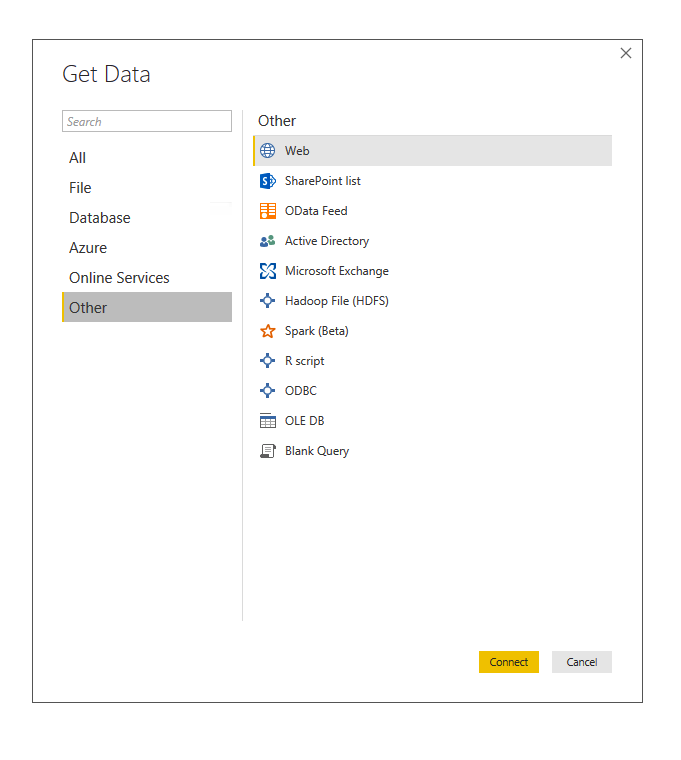
Once you have decided on your API call, open Power BI Desktop and select Get Data and then choose “Web” as your source. 
Enter the URL for your API call that you want to retrieve data with. In this case I am performing a private.request.search to return all the requests in xCategory 1.

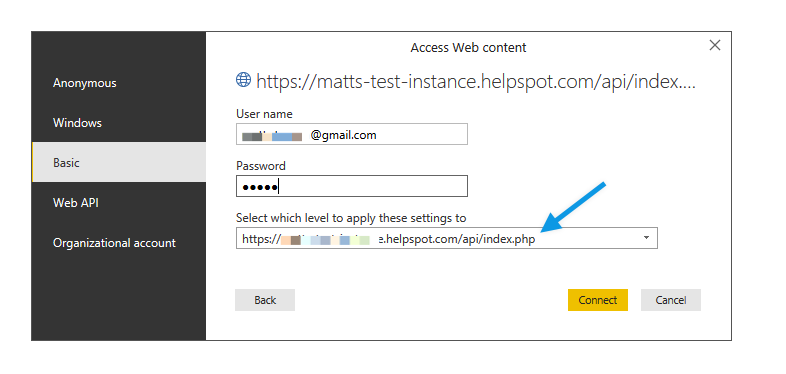
Next, on the authentication page choose “basic”, enter your credentials and make sure the “index.php” level of the API path is selected.

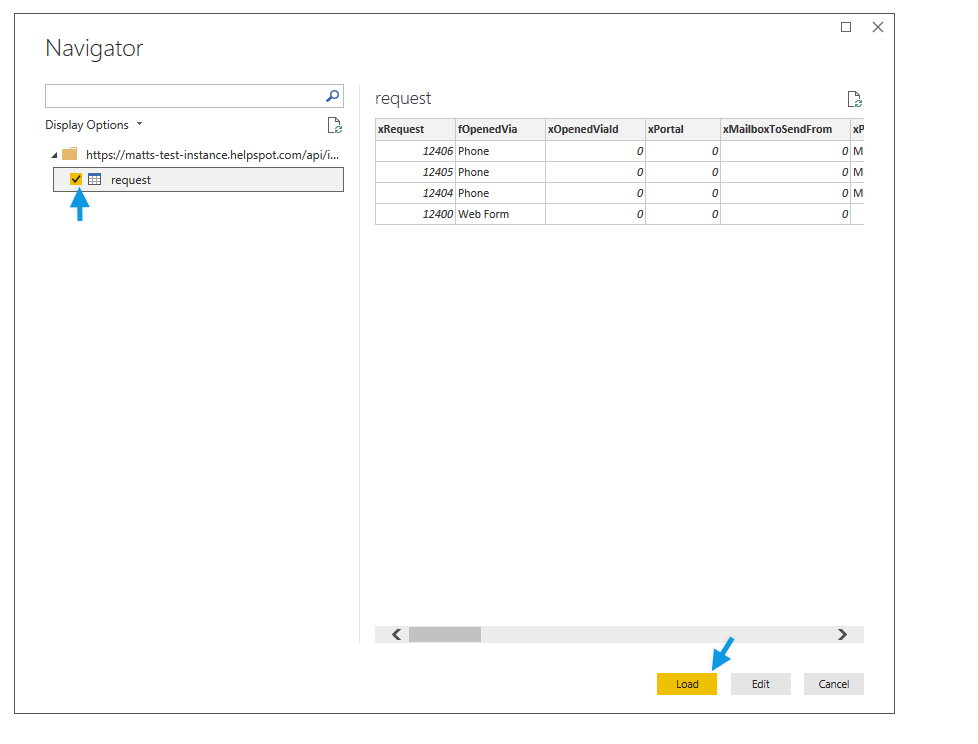
Microsoft Power BI will then query HelpSpot and return the result set. Select the result set and choose “load”.

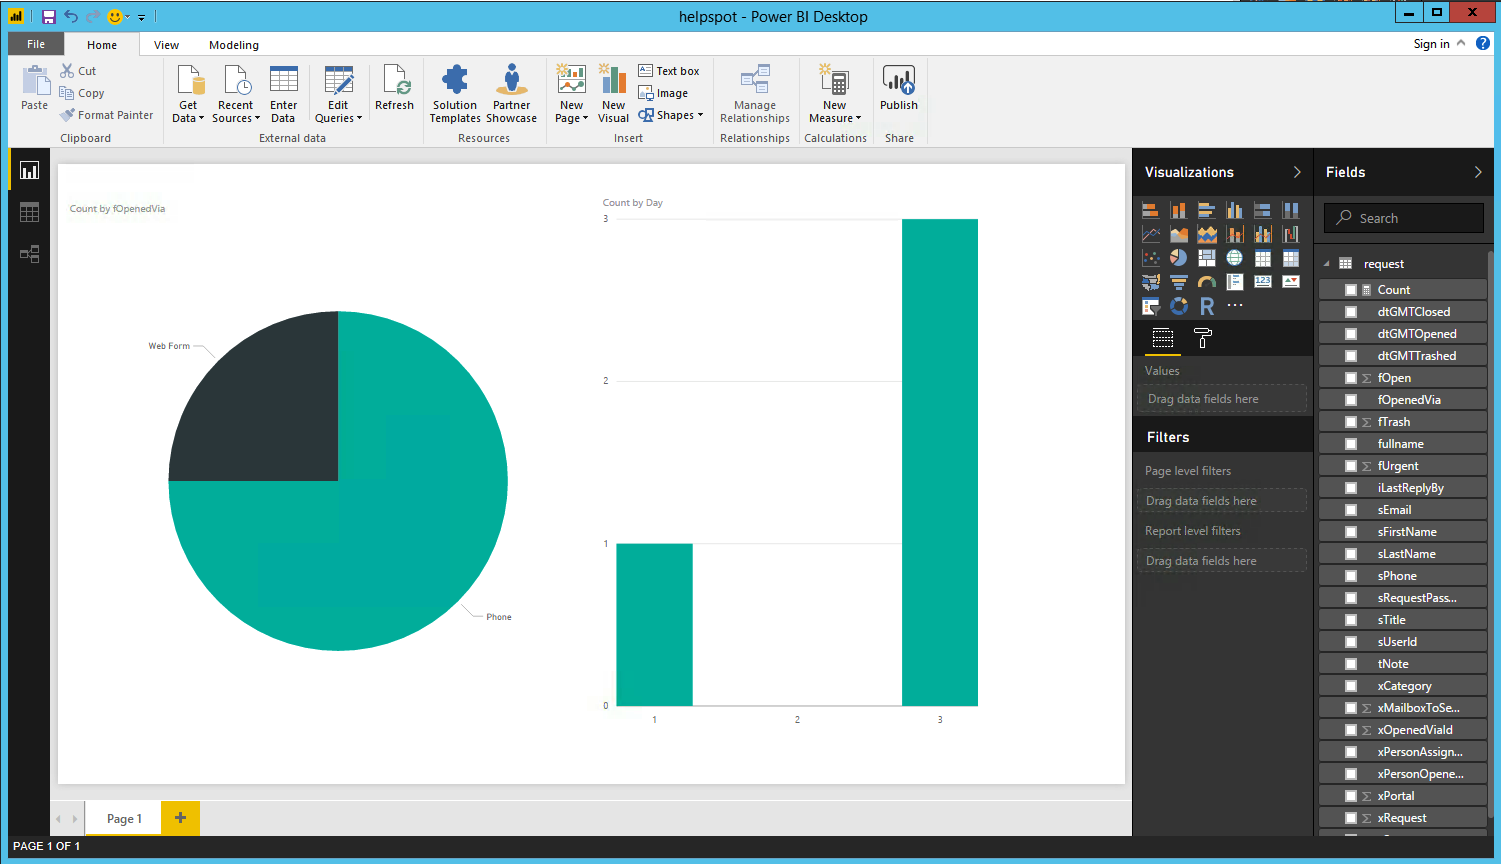
Your data will now be loaded into Power BI for building dashboards, charts and reports. You data can also be refreshed at any time by using the Power BI tools.

