Comparison Matrix
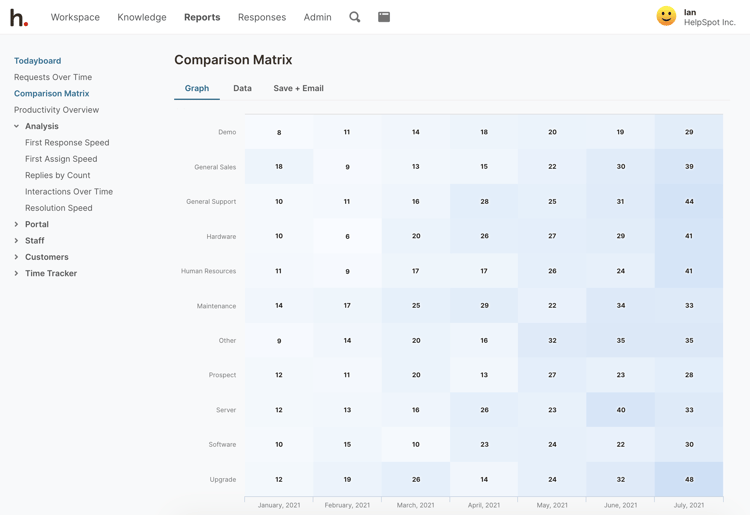
Working with help desk metrics can be challenging. The comparison matrix report provides an easy visual interface to your metrics.

Powerful Analysis Through Comparison
It's often hard to utilize your help desk metrics. However, the graphical presentation of the comparison matrix makes key insights pop off the screen.
Quickly see all your categories across time to spot trends, compare categories with assigned users
to see what everyone is working on at a glance, even compare across custom fields.
Filters
Utilize HelpSpot's filtering engine to filter based on dozens of criteria and thousands of potential combinations so you can drill down
to exactly what you need to see.
Save Reports & Email Reports
Once you've dialed in your report exactly as you want it save it so you can instantly access it again in the future. Share your
report with teammates, so you're all working off the same report.
Saved reports can then be scheduled to be emailed right to your inbox.
Saved reports can then be scheduled to be emailed right to your inbox.
Export
Export any report to CSV to work with it in Excel.
